Dashboard Widget
What will be covered in the below sections.
What is it?
Known as WidgetDashboard Control, this control has the capacity to display a Table and/or a Chart with the same data fetched from Dynamics 365 queries.
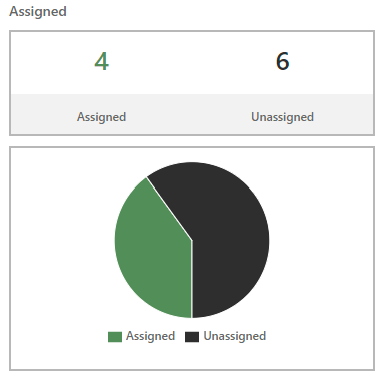
Example: Displays counts of Assigned and Unassigned tasks in Table and Pie chart formats.
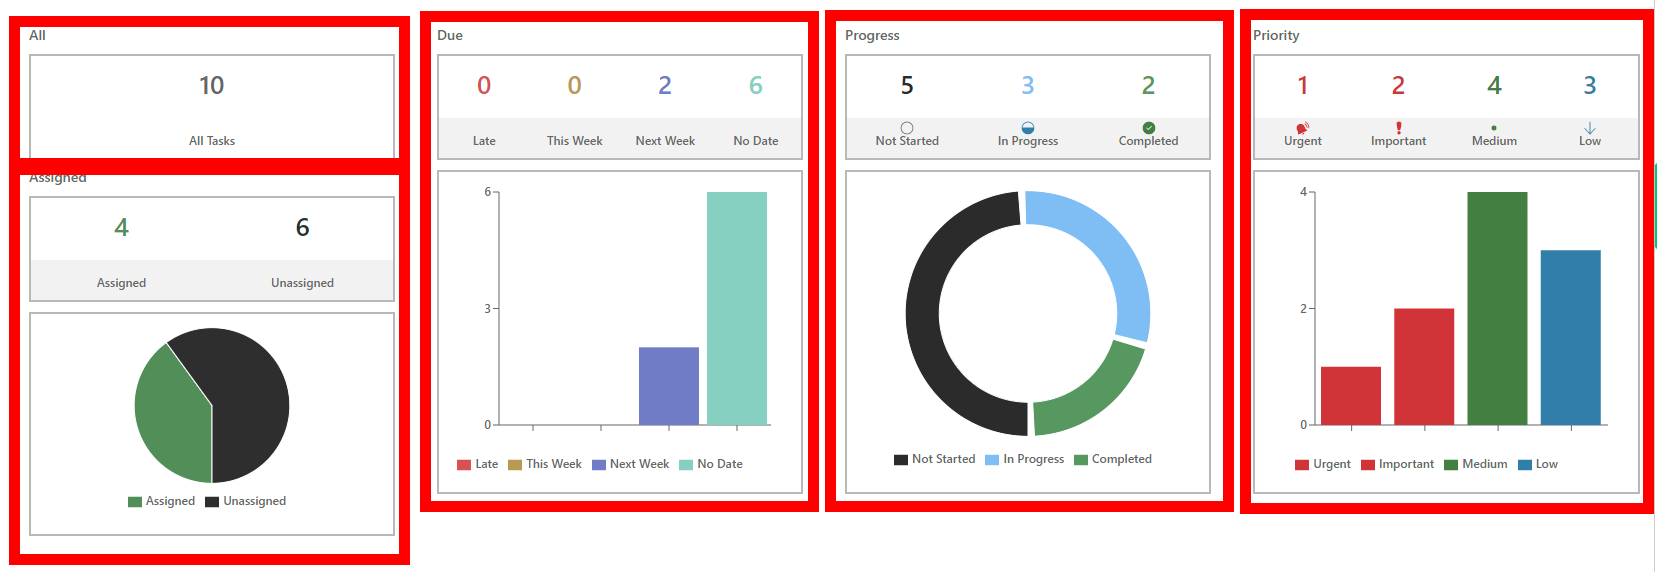 Example: shows five of the different ways this one widget can be configured
This widget has two key components; N Column based Table, and an optional Chart (Pie, Bar or Donut) which will represent the data from the table above.
How to setup a new instance of the widget
- Navigate to the desired form in the classic designer.
- Navigate to desired tab
- Click on desired tab
- Insert new SubGrid
- Drag in a field to be used as a dummy. i.e. "Location" field (sensei_location)
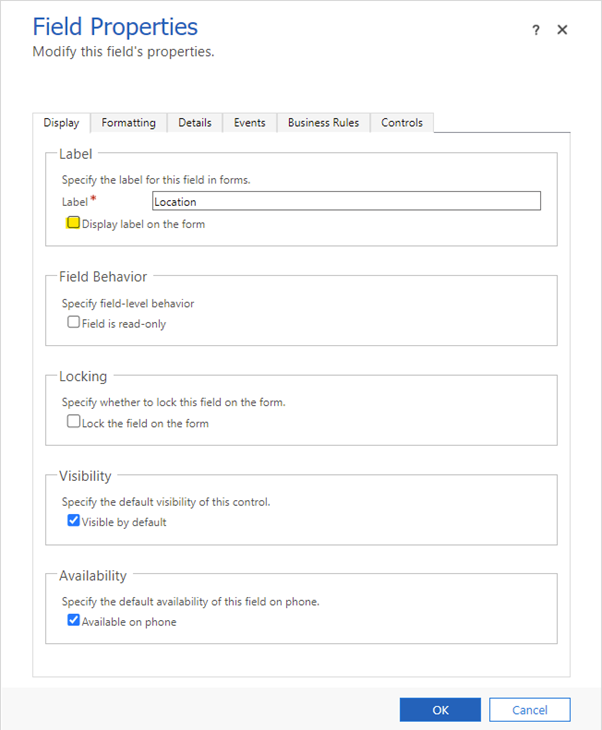
- Double click on the added Field and uncheck display label
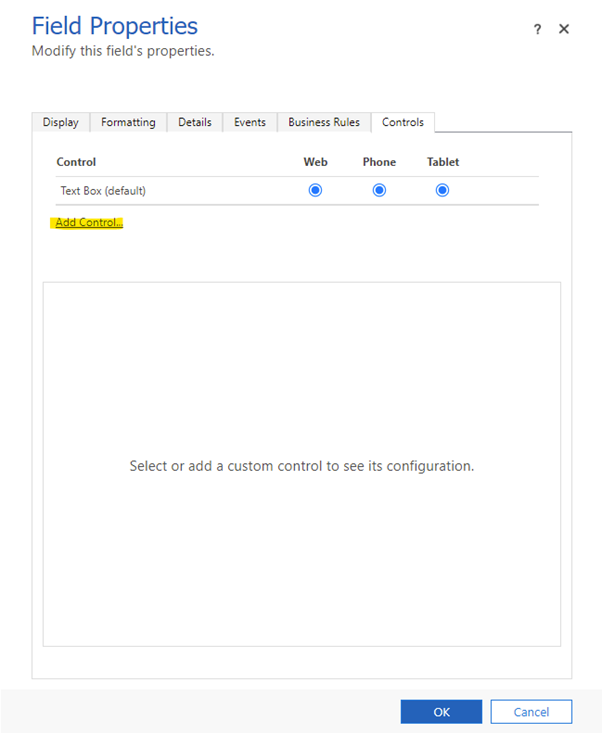
- Navigate to the "Controls" tab then Click Add Control and find "Sensei Dashboard Widget" and click Add
- Configure the settings - setting Web/Phone/Tablet to use the control then we edit the JSON config setting using the pencil
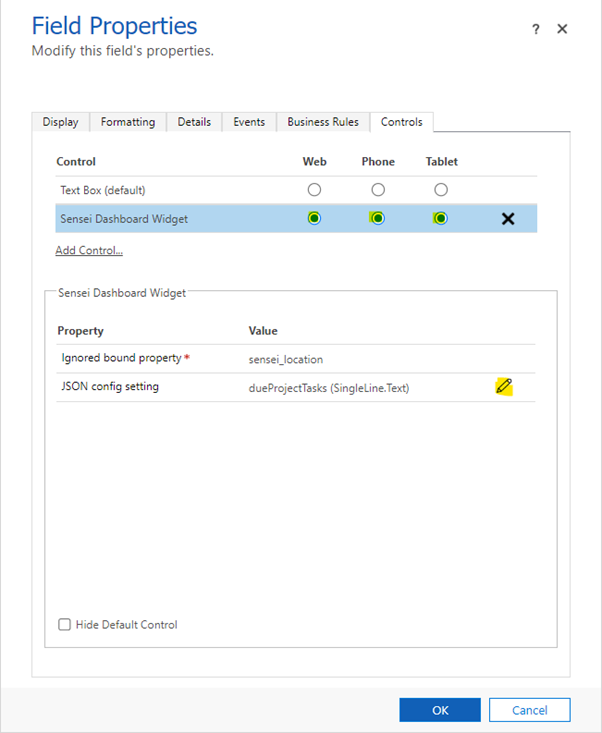
- Specify the desired config setting name that we will create shortly.
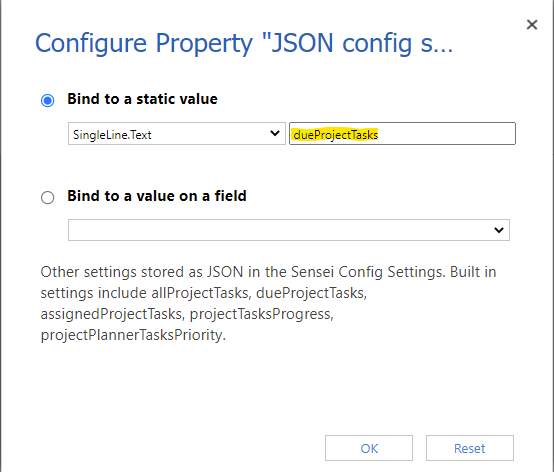
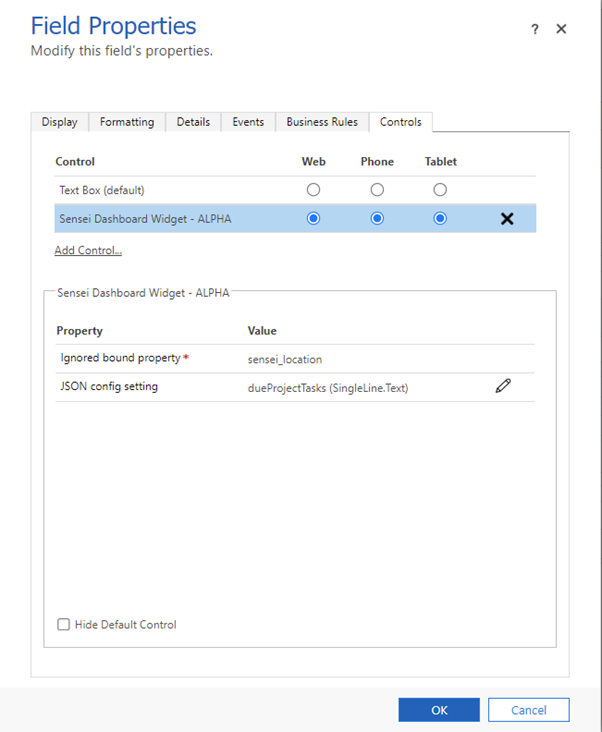
- When complete you should have a window that looks similar to the following. Click OK.
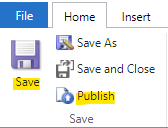
- Now Save then Publish the Form.
We are now going to create a Sensei IQ Setting. Navigate to the Setttings > Configuration Settings. Now Duplicate the current tab as we will use this later on. Now click "New" in the hot bar on the first tab.
The main things that need to be filled out is Display Name and Name, which Name should match what was set in step 10.
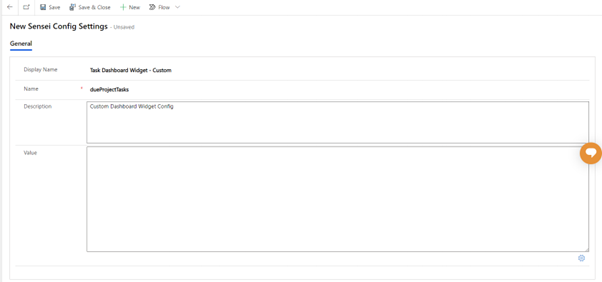
- Switch to second tab we duplicated earlier and locate an existing Active/Inactive Sensei IQ Setting for Task Dashboard Widget. Double click it to open it then Click the gear in the bottom right corner.
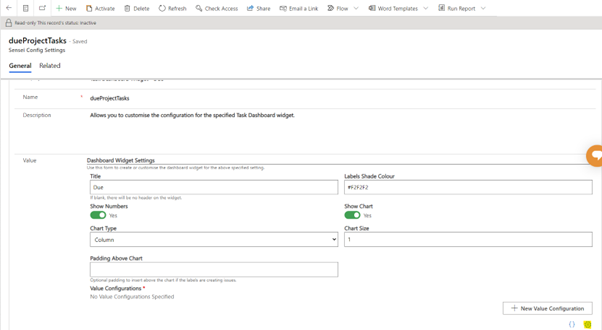
- Copy the contents of the two textboxes across to the first tabs gear icon, this will allow for easy editing of the configuration setting.
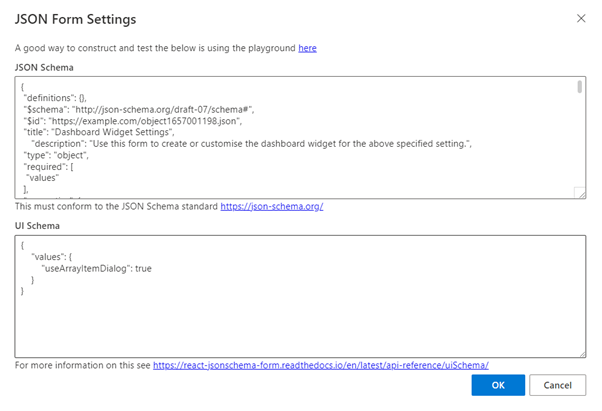
- Congratulations! You're now ready for the next step which is Widget Configuration found below.
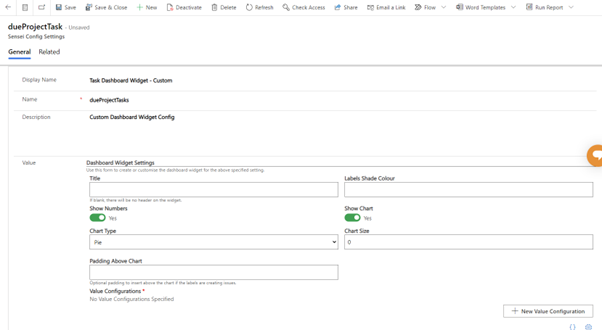
Widget Configuration
If you wish to customize what is shown in the widget you need to adjust the appropriate Sensei IQ Setting.
Found under Settings > Configuration Settings > Active/Inactive Sensei Config Settings
Each widget should have its own configuration setting configured while adding to form.
In the case of Planner the following configuration settings are overrides for default configuration of the widget.

There are two screens that allow for modification to how the widget is displayed.
Main Settings screen:
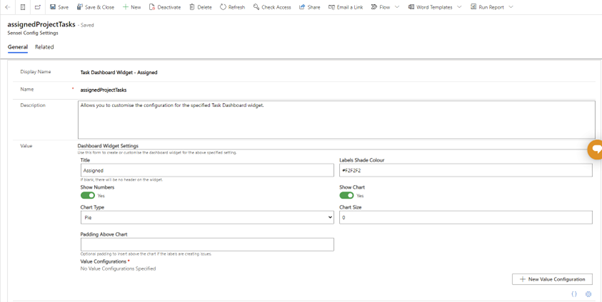
Has the following options:
| Option | Description |
|---|---|
| Title | Set the title on the widget. If blank, there will be no header on the widget. |
| Labels Shade Colour | This is the colour of the background of the labels found in the table. |
| Show Numbers | Toggle if the Table is to be shown. |
| Show Chart | Toggle if the Chart is to be shown. |
| Chart Type | Select form of Chart to be displayed (Pie, Column, Donut) |
| Chart Size | Increases the scale of the chart |
| Padding Above Chart | Optional padding to insert above the chart if the labels are creating issues. |
| Value Configurations | These are the values that are rendered in the Table and/or Chart. |
Value Configurations screen:
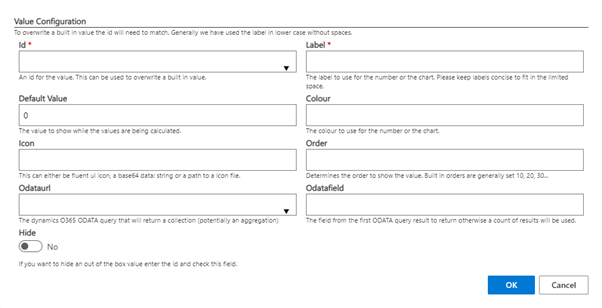
It has the following options:
| Option | Description |
|---|---|
| Id | An id for the value. This can be used to overwrite built in value. |
| Label | The label to use for the number or the chart. Please keep concise to fit in the limited space. |
| Default Value | The value to show while the values are being calculated. |
| Colour | The colour to use for the number or the chart. i.e. #FF0000 for red. |
| Icon | This can either be fluent ui icon, a base64 data:string or a path to a icon file. |
| Order | Determines the order to show the value. Built in orders are generally set to 10,20,30.. |
| Odataurl | The dynamics O365 ODATA query that will return a collection (potentially an aggregation) |
| ODatafield | The field from the first ODATA query result to return otherwise a count of results will be used. |
| Hide | If you want to hide an out of the box value enter the id and check this field. |
Editing an existing setting
- Activate the Deactivated Setting by using the top hot bar.
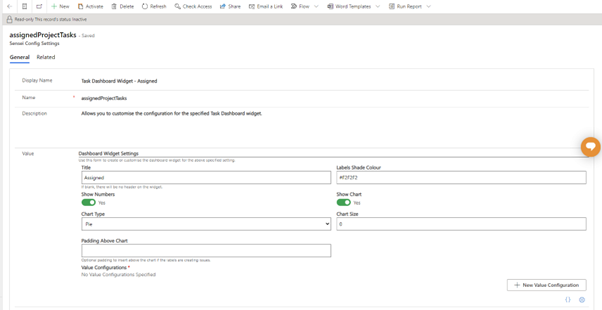
- Click + New Value Configuration to add a new value

- Click the pencil to edit it.
- We have a few options of what we can do > [!NOTE] To overwrite a built in value the id will need to match. Generally we have used the label in lower case without spaces.
Possible Customizations:
i. Hide an existing value. Enter the Id, then select Hide slider at the bottom of the page
ii. Override an existing value. Enter the Id, then Label as these are mandatory fields. All other fields if not filled in will default to the default configuration setting.
iii. Create a new value. Enter the desired Id (this must be unique), then Label that you want displayed. You will need to fill out all the following fields or it can result in No Data being displayed due to incorrect configuration.
Options to customize are as follows:
Example of Default configuration for Assigned:

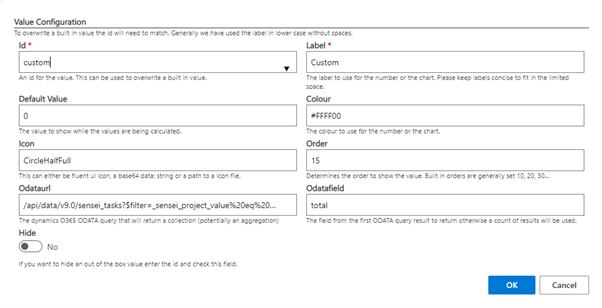
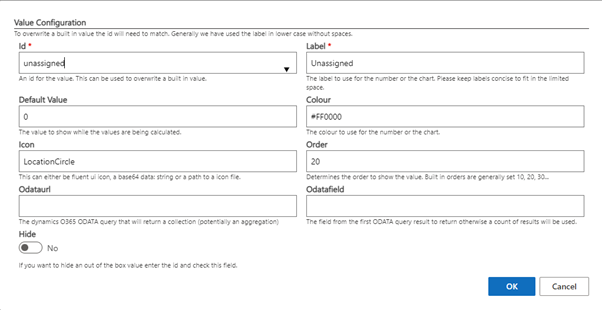
Example of Customized configuration setting for Assigned. In this example we have added a web resource as an icon to assigned. Inserted a custom yellow odata query with a custom fuent ui icon and we have changed the colour and added an icon to unassigned.
Example:
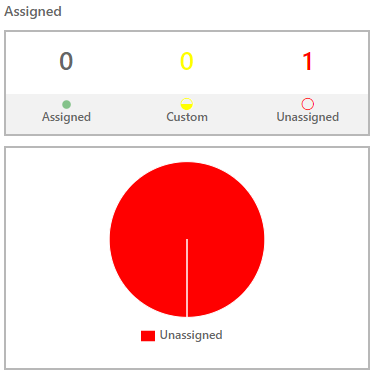
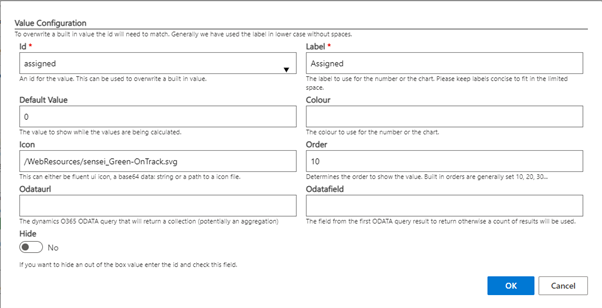
Assigned Configuration - override:
Custom Configuration:
Unassigned Configuration - override:
Default Value – The value shown while the values are being calculated
Colour – The colour used for the number of the chart starting with #
Icon – This can either be fluent ui icon, a base64 data: string or a path to a icon file
Examples are as follows:
- Fluent ui - "6PointStar"
- base64 image - "data:image/png;base64," ( represents the base64 encoded string)
- path to webresource - "/WebResources/sensei_Green-OnTrack.svg"
Order – Determines the order to show the value. Built in order are generally set 10, 20, 30 …
- in our example we set custom to be 15 which is inbetween 10 and 20.
Example of where Order of 15 is used on existing Assigned widget will place it in the middle of Assigned and Unassigned.
Odataurl – The dynamics O365 ODATA query that will return a collection (potentially an aggregation)
The Odataurl query is made up of the following pattern as a minimum.
Note
{{value}} denotes a value that should be substituted for by consultant. {parentId} will be substituted in.
/api/data/v9.0/{{entity_name}}?filter=_sensei_project_value eq "{parentId}"
This will be attached to the end of the current dynamics environment to generate the query. The following query will be counted as no aggregation value is provided.
i.e. https://orgXXXXXXXX.crmY.dynamics.com/api/data/v9.0/sensei_tasks?filter=_sensei_project_value%20eq%20%27{parentId}%27
URI Encoded:
/api/data/v9.0/{{entity_name}}?filter=_sensei_project_value%20eq%20%27{parentId}%27
Example of:
- Simple Count
/api/data/v9.0/sensei_tasks?$filter=_sensei_project_value eq '{parentId}' and sensei_resourceassignment_task_sensei_tas/any()
- Aggregation of values
/api/data/v9.0/sensei_tasks?$filter=_sensei_project_value eq '{parentId}' and sensei_resourceassignment_task_sensei_tas/any()&$apply=aggregate(sensei_taskid with countdistinct as total)
- Sum of financials
/api/data/v9.0/sensei_financialtransactions?$filter=_sensei_project_value eq '{parentId}' and sensei_type eq 955000000&$apply=aggregate(sensei_value with sum as total)
- Max date
/api/data/v9.0/sensei_tasks?$filter=_sensei_project_value eq '{parentId}'&$apply=aggregate(sensei_duedate with max as maxdue)
Odatafield – The field from the first ODATA query result to return otherwise a count of results will be used. In the above example a value total is used.
Note
If an Odataurl and Odatafield are not provided no data will be displayed for the chart.